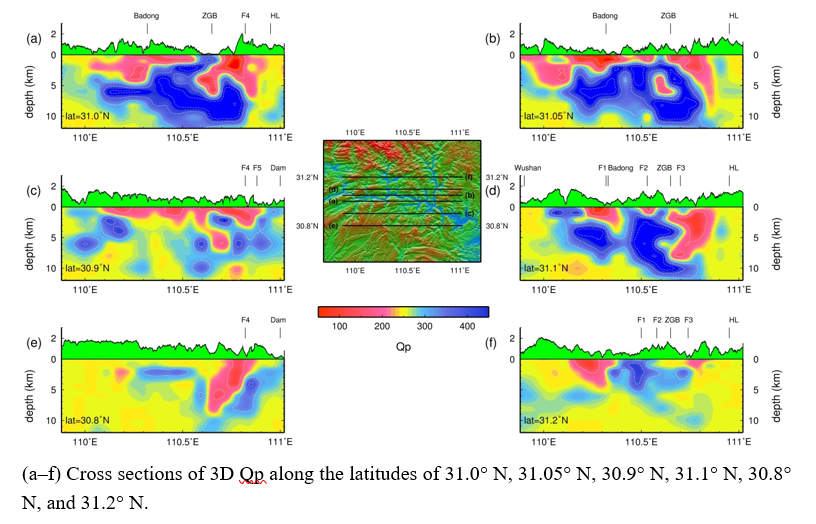
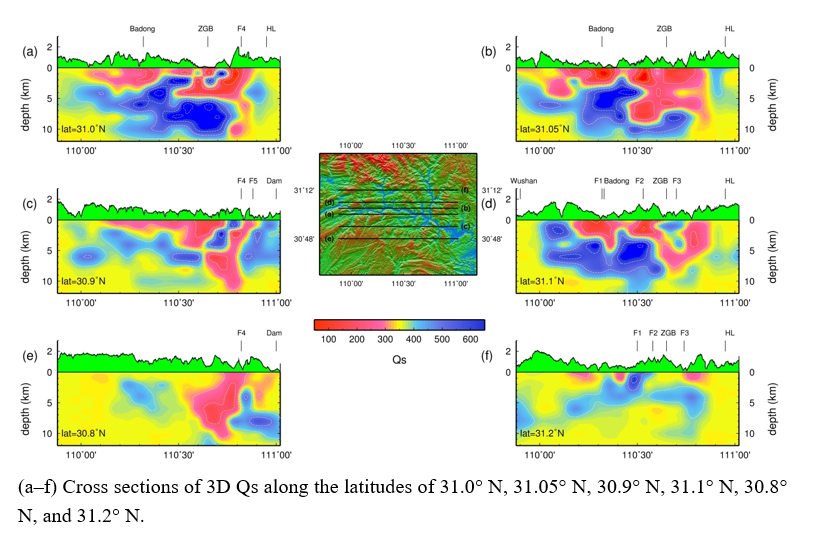
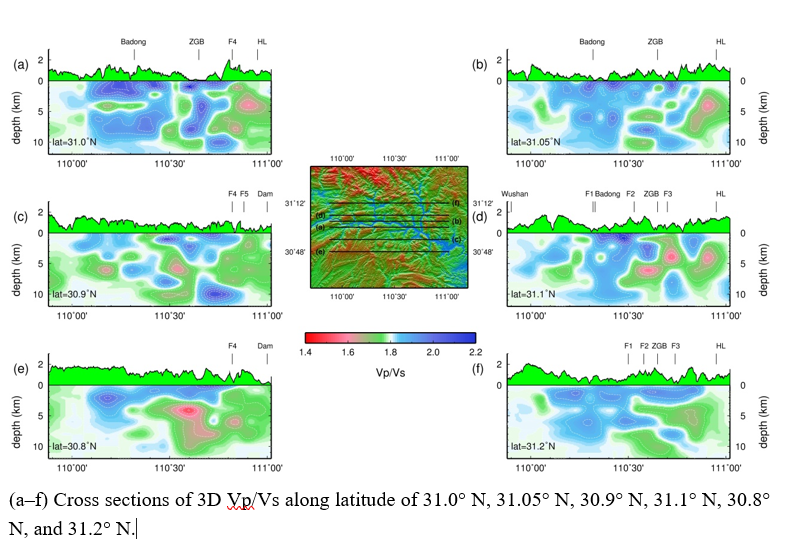
Abstract Combination of velocity, Poisson’s ratio, and attenuation structure is a powerful tool to investigate the characteristics of media, and it is especially useful to infer the lithology, porosity, water content of rocks, fluid infiltration depth, and distribution in the reservoir area. Using data from 4967 earthquakes recorded by a high-density seismic network, we carried out high-resolution 3D Vp, Vp/Vs, Qp and Qs tomography research in the Three Gorges Reservoir area of China, where the world’s largest high-capacity hydroelectric power station is located. We found two regions with significantly low Vp, high Vp/Vs, and low Qp and Qs; one is the region between the Shuitianba fault and the western edge of the Huangling dome, and the other is the Badong region on the upstream Yangtze River, where more than 2000 earthquakes occurred in four months after the reservoir was first impounded. We infer that there is significant fluid infiltration in the two regions. The interior area of the Zigui basin is shown as a low-Vp region at depths of 0-6 km, which is consistent with the depth to crystalline basement. The Three Gorges dam area is a region with moderately high Vp, low Vp/Vs, and prominently high Qp, and Qs, demonstrating no obvious water infiltration around the dam area. Combining present results with previous studies, we draw a conclusion that the distance away from main rivers, lithologies, and the presence of faults are the main factors contributing to the fluid infiltration distribution beneath the reservoir region.
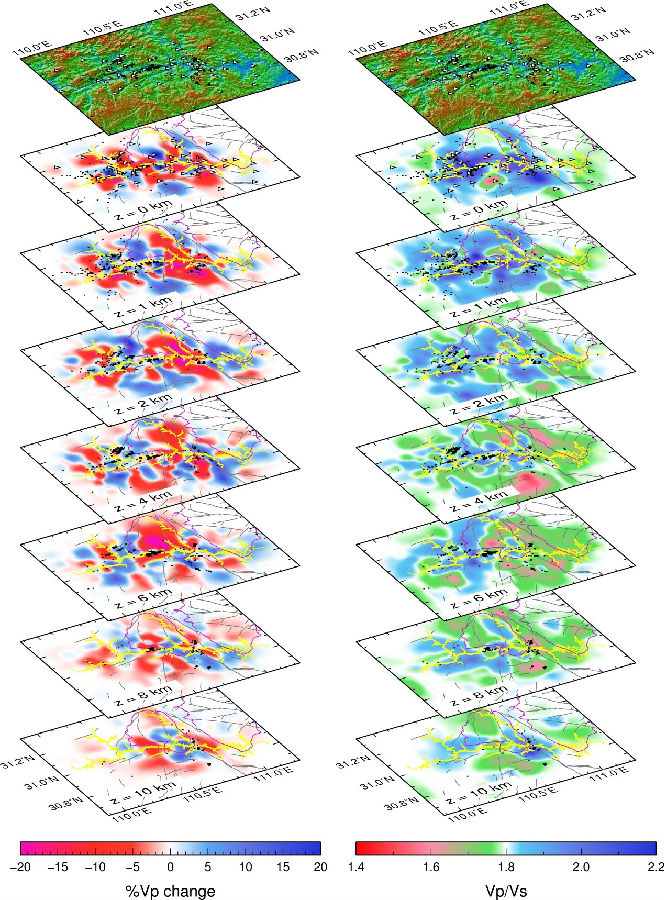
Inversion results of (a) Vp change relative to 1D initial reference model and (b) Vp/Vs ratio models at different layers. Hypocenters in the range of 1 km are projected on each layer. Stations are marked by triangles. Rivers are denoted by yellow curves. The Zigui basin and Huangling dome are plotted by purple curves. Faults are shown as black lines. Topography is shown on top. Black dots mark the epicenters used in inversions.
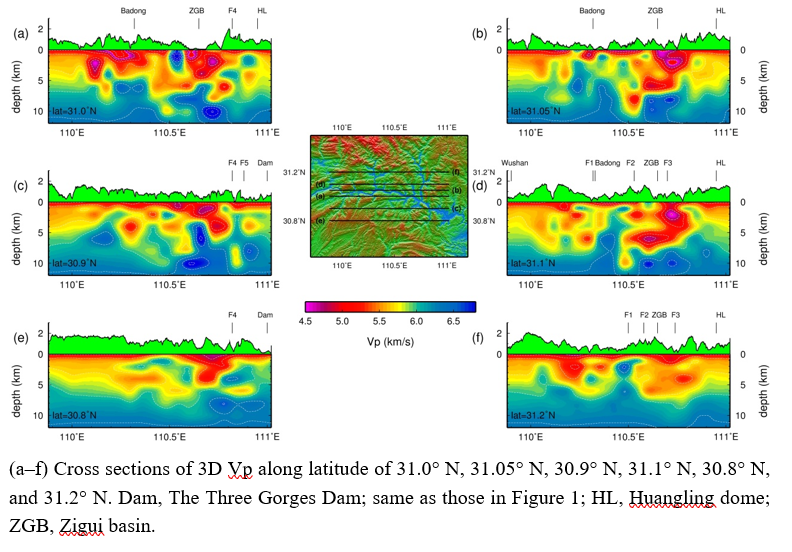
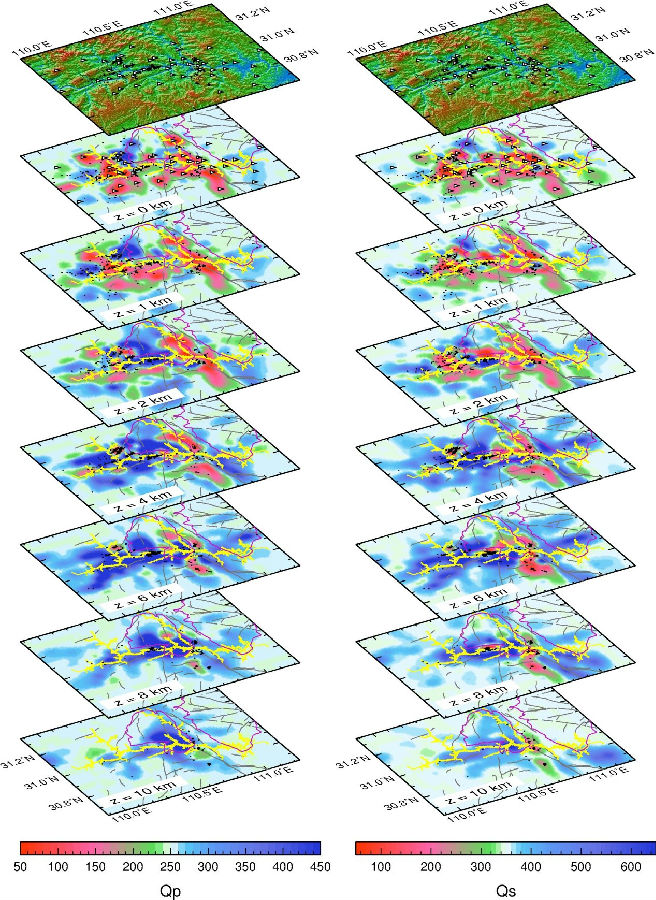
Inversion results of (a) Qp and (b) Qs models at different layers. Hypocenters in the range of 1 km are projected at each layer. Stations are marked by triangles. Rivers are denoted by yellow curves. The Zigui basin and Huangling dome are plotted by purple curves. Faults are shown as black lines. Topography is shown on top. Black dots mark the epicenters used in inversions.
