Abstract
In this study, we investigate the VLF signals in the ionosphere propagating from ground based transmitters by using the data from the newly launched CSES (China Seismo-Electromagnetic Satellite), which is also called ZH-1.The simultaneous ionospheric perturbations and electron precipitations induced by the NWC transmitter are also analyzed, and the possible mechanisms are discussed. The ZH-1 and DEMETER observations of VLF transmitters are compared morphologically, which are generally consistent with the full wave simulations. The results show that the electromagnetic waves excited by the VLF transmitters penetrate into the ionosphere and propagate in the magnetosphere to its conjugate hemisphere as a ducted or non-ducted whistler. When the VLF transmitter is located at L <1.5, the wave propagates more easily as a non-ducted whistler. When the wave propagates as a ducted whistler, the point of maximum observed transmitter-induced electric field in the conjugate hemisphere will move poleward in the northern hemisphere and equatorward in the southern hemisphere. The results also show that the data stability of electromagnetic field recorded by ZH-1 satellite is almost the same as DEMETER satellite, and there is a good correlation between the ZH-1 observation and simulated results. These conclusions demonstrate that the night-side VLF band electromagnetic observation of ZH-1 satellite is stable and reliable.

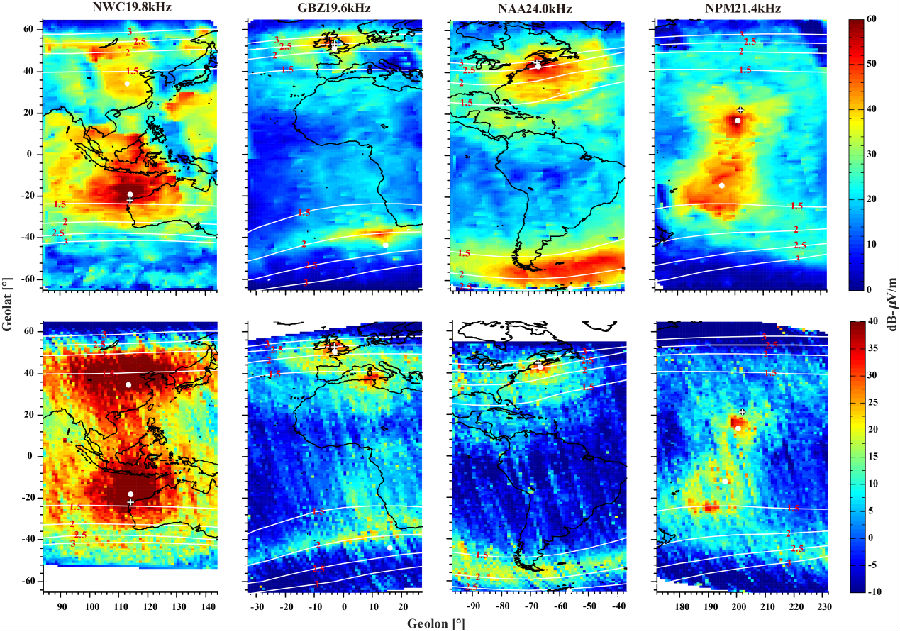
Figure 1. The electric field record by ZH-1 (top panel) and DEMETER (bottom panel). The white crosses show the location of the transmitters. The white dots display the crossing points of the geomagnetic field line that begins at 80 km above the transmitters at the altitude of satellites. The white contour lines represent the L value contour at the satellite altitude. There is another bright spot near GBZ (19.8 kHz) above Mediterranean in the DEMETER observation, which is radiated by ICV (20.3 kHz) located at Isola di Tavolara, Italy.

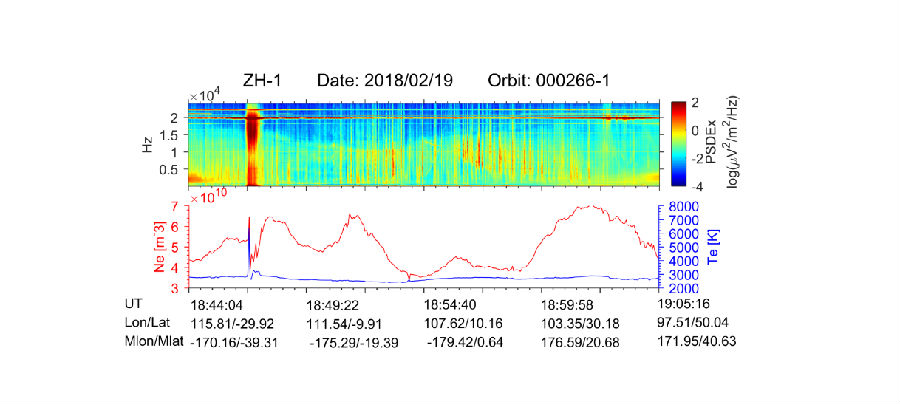
Figure 2. An ionospheric heating event recorded by ZH-1 on February 19, 2018. The first panel shows the electric field power spectra from 0 Hz to 25 kHz, and the second panel shows the electron temperature (blue) and electron density (red).

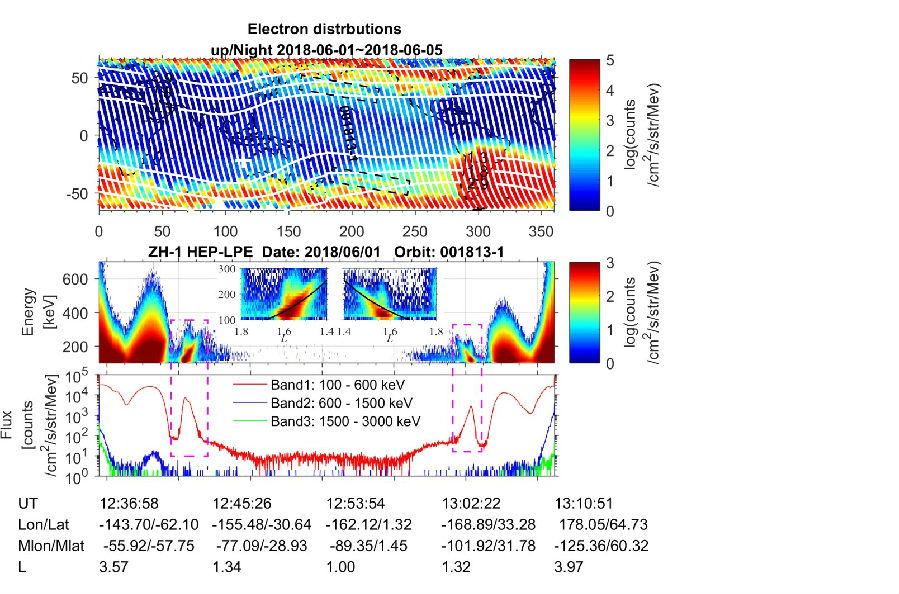
Figure 3. Energetic precipitation caused by NWC. First panel: the global distribution of energetic electron (0.1 - 3 MeV) flux observed by the ZH-1 at night side. The white cross represents NWC transmitter. The white contour lines represent the L value contours at the satellite altitude. The strips of energetic electron precipitation caused by NWC are marked by the two black dash rectangles. Second panel: the energy spectra (0-700 keV) of orbit (001813-1, marked in the first panel) is shown on the figure. Two typical energy-dispersed ‘wisp’ structures have been marked by magenta dash rectangles at around L = 1.8. The electron energy-L spectrograms near the resonance zones at the Southern hemisphere (left) and Northern hemisphere (right) are shown in the subgraph. The black solid curves represent the results of the computation of the energy of electrons being resonant with 19.8 kHz. Bottom panel: integrated flux of energetic electrons of three bands: 100 to 600 keV, 600 to 1500 keV, and 1.5 MeV to 3 MeV.

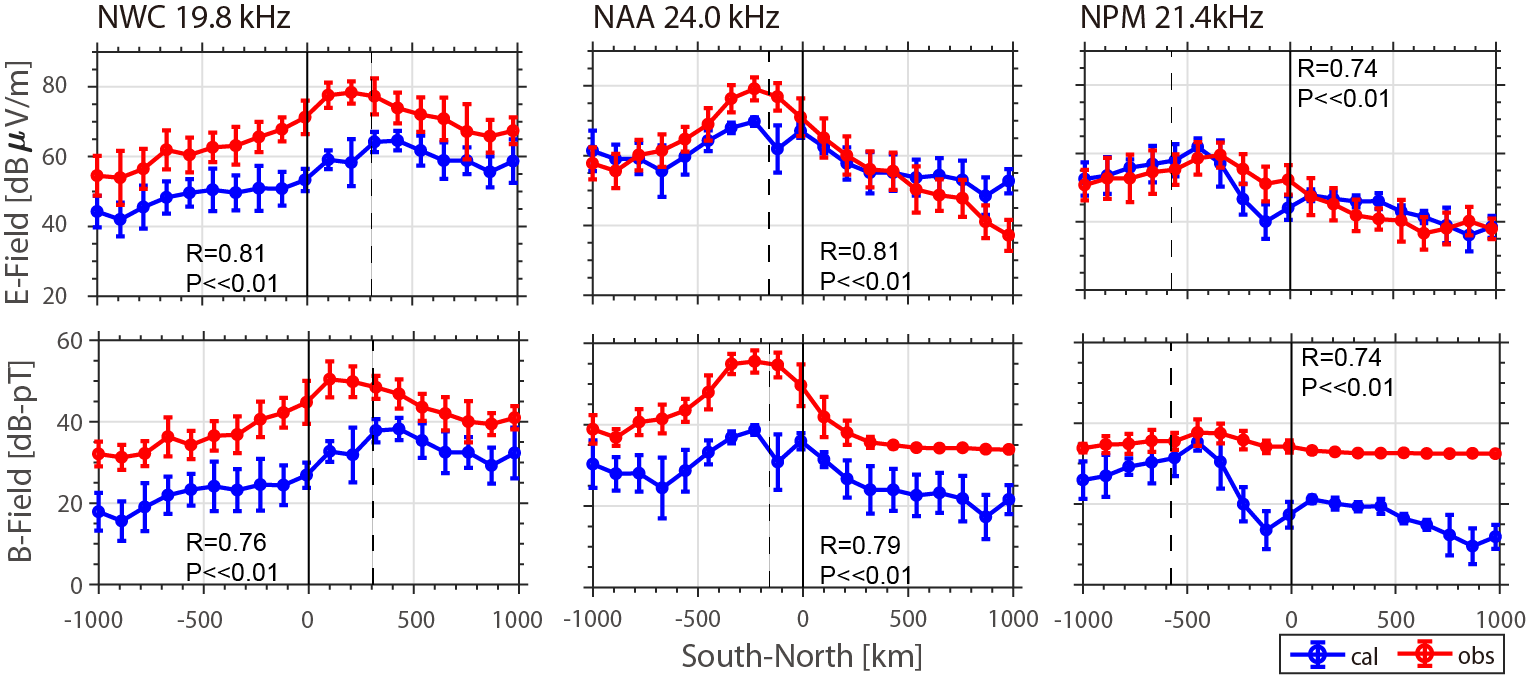
Figure 4. Comparison of electric field (top panel) and magnetic field (bottom panel) excited by VLF transmitters (NWC, NAA, NPM) between ZH-1 satellite observation and simulations. The R value represents the correlation coefficient. The P value represents whether the correlation coefficient has statistical significance. The vertical solid and dashed lines have same meaning as Figure 8.


