Abstract: On November 25, 2016, the Mw 6.6 Aketao earthquakeoccurred in Xinjiang, western China. We used thecombination of ascending Sentinel-1A, descending Sentinel-1Band ascending ALOS-2 PALSAR data to measure the coseismicdeformation. The line-of-sight (LOS) coseismic deformationimplies that the earthquake was dominated by right-lateral strikeslip.Ignoring the fault-perpendicular deformation, the fault-paralleland up–down deformation was extracted based on the combinationof Sentinel-1A and 1B observations. Results show that the maximumfault-parallel deformation is * 13.7 cm at the north wall andthe minimum is * -16.5 cm at the south wall of the Muji fault.Then, coseismic slip distribution was derived using the steepestdescent method (SDM) based on a single-segment fault modelusing the three InSAR LOS observations as constraints. The slipdistribution reveals two slip centers. The maximum slip of theeastern center is 0.5 m at a depth of 8.8 km, where the rake angleis * 181.2 [1]. The maximum slip of the western center is 0.6 m at adepth of 10.8 km, where the rake angle is * 181.1 [1]. The derivedseismic moment obtained equals the Mw 6.6 earthquake. In thisstudy, postseismic deformation time series in 1.5 years after theearthquake were retrieved from 26 multi-temporal Sentinel-1descending scenes. The postseismic LOS deformation at the northand south walls of Muji fault both increases with time but inopposite directions. The cumulative deformation is 60–80 mm atthe north wall, and –30 to -20 mm at the south wall. The postseismicdeformation shows similar patterns with the coseismicdeformation, and has the same mechanism. There is no obviouslock at the unbroken gap.
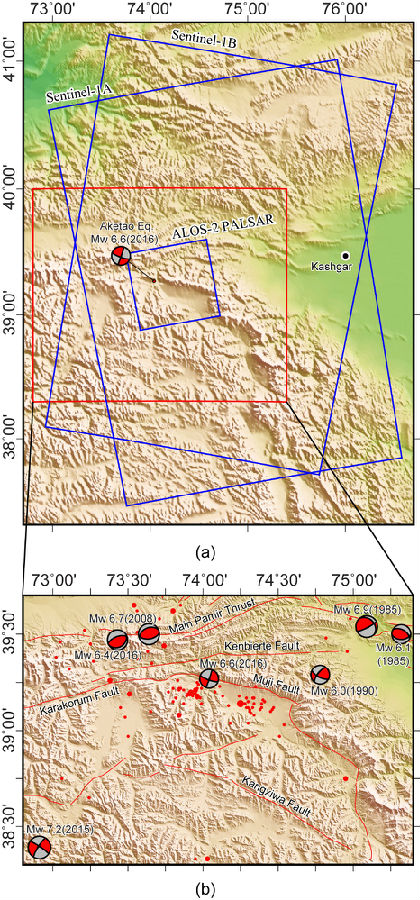
Figure 1. Shaded relief map showing the coverage area of SAR images listed in Table 1. The background is the 30-m shuttle radar topography mission (SRTM) digital elevation model (DEM). Blue rectangles indicate the coverage of Sentinel-1 SAR images acquired in ascending and descending orbit, and the ALOS-2 Phased-Array L-Band Synthetic Aperture Radar (PALSAR) image acquired in ascending orbit, respectively. Red lines show in Fig. 1b represent the active fault traces. Beach balls represent the focal mechanism solutions of historical events with magnitude larger than Mw 6.0 from the GCMT. The event of Mw 6.6 (2016) represents the mainshock of this case. Red rectangle indicates the study area as shown in Fig. 1b. Smaller red circles indicate aftershocks
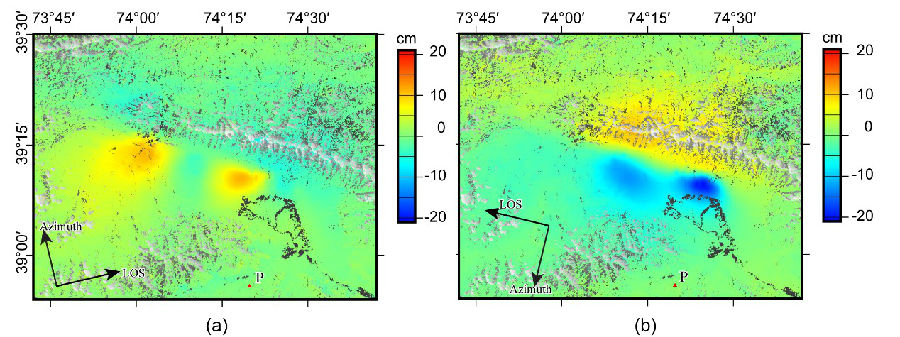
Figure 5. Normalized LOS deformation maps of Sentinel-1A ascending (a) and Sentinel-1B descending (b). Positive (red) denotes range shortening in LOS direction, and negative (blue) denotes range extending in LOS direction. P (red triangle) represents the reference point location for normalization.
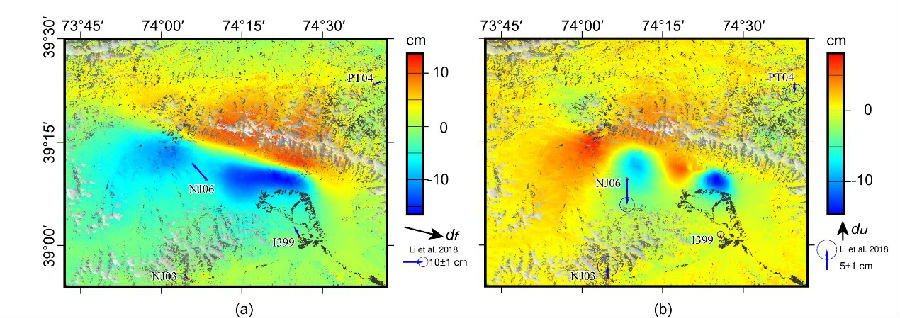
Figure 6. Decomposition of LOS deformation. (a) Fault-parallel deformation. Black arrow represents direction along the fault-parallel direction of the df, positive (red) denotes SEE deformation along the df, negtive (blue) denotes the reverse; blue arrows represent the GPS displacements in horizontal direction. (b) Up-down deformation. Black arrow represents up-down direction, positive (red) denotes uplift, negtive (blue) denotes subsidence; blue arrows represent the GPS displacements in vertical direction. GPS displacements were obtained from Li et al. (2018).
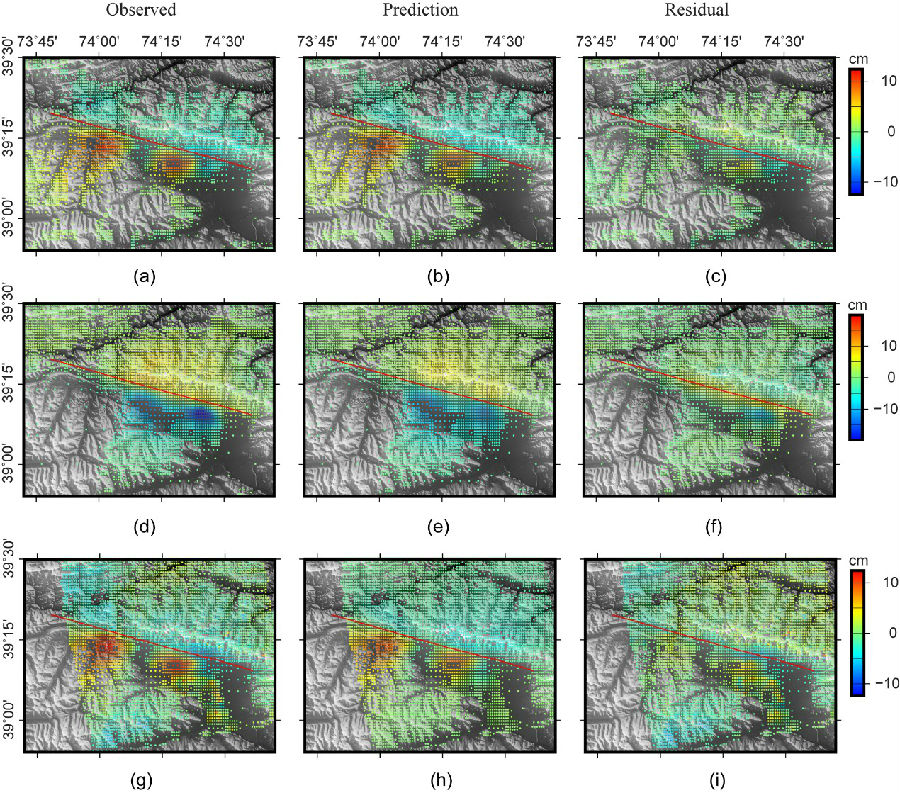
Figure 7. InSAR observed deformation, simulated deformation and residuals.
(a - observed, b - simulated, c - residuals for Sentinel-1A ascending data; d - observed, e - simulated, f - residuals for Sentinel-1B descending data; h - observed, i - simulated, j - residuals for ALOS-2 PALSAR ascending data)
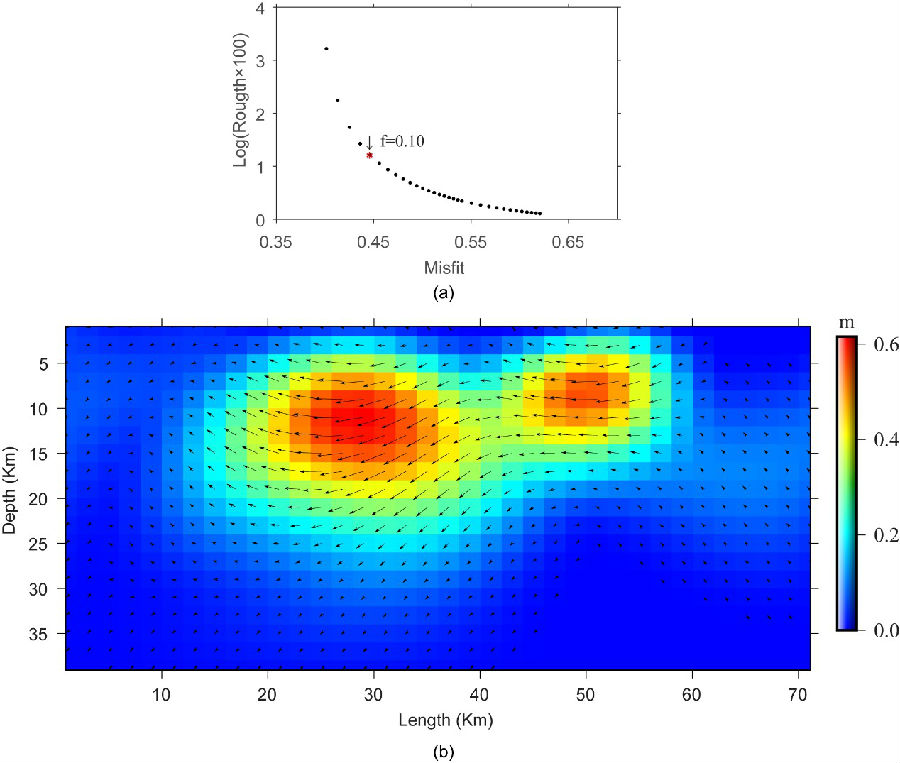
Figure 8. Slip distribution modeling results. (a) Trade-off curve between misfit and slip roughness. The preferred smoothing factor used in our inversion is 0.10. (b) Fault slip distribution of Aketao earthquake. Arrow represents the slip direction of each patch.
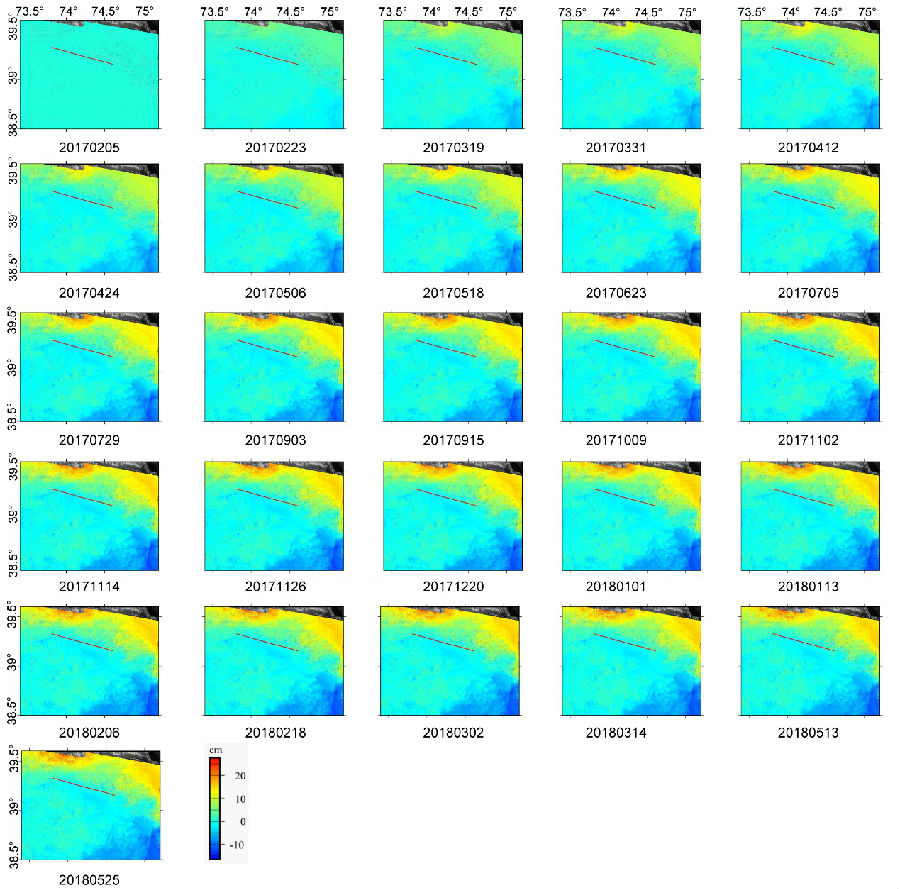
Figure 10 Post-seismic deformation time series. The first panel is the reference LOS deformation map of the first SAR data acquisition after the earthquake.
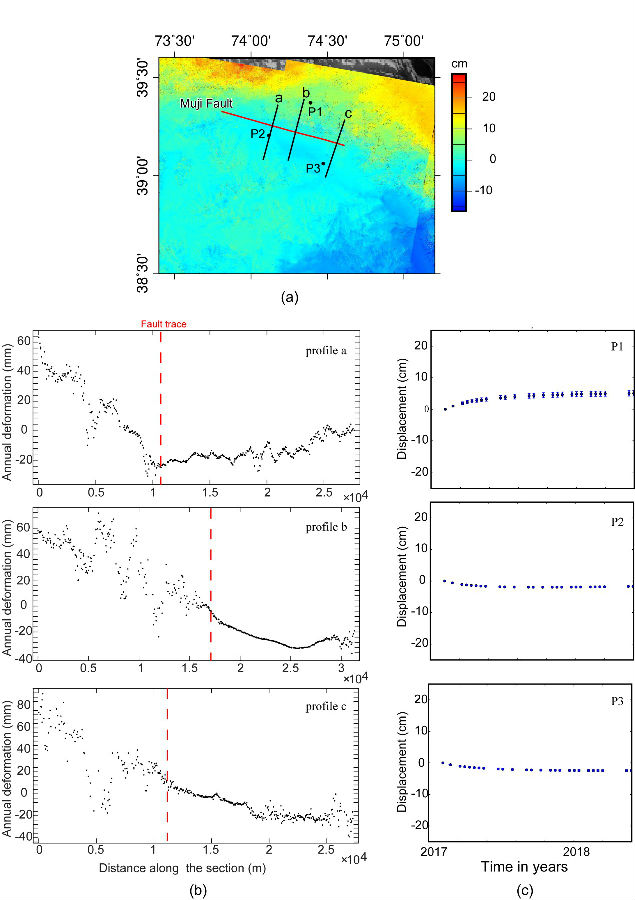
Figure 11. Postseismic deformation along the profiles across the Muji fault. (a) Cumulative postseismic deformation obtained on May 25, 2018. Red line represents the Muju fault trace; a, b and c denote three profiles across the fault; P1, P2 and P3 denote three selected points for time series postseismic deformation analysis. (b) Postseismic deformation along the three profiles a, b, and c. (c) Time series displacements at the three selected points P1, P2 and P3.


