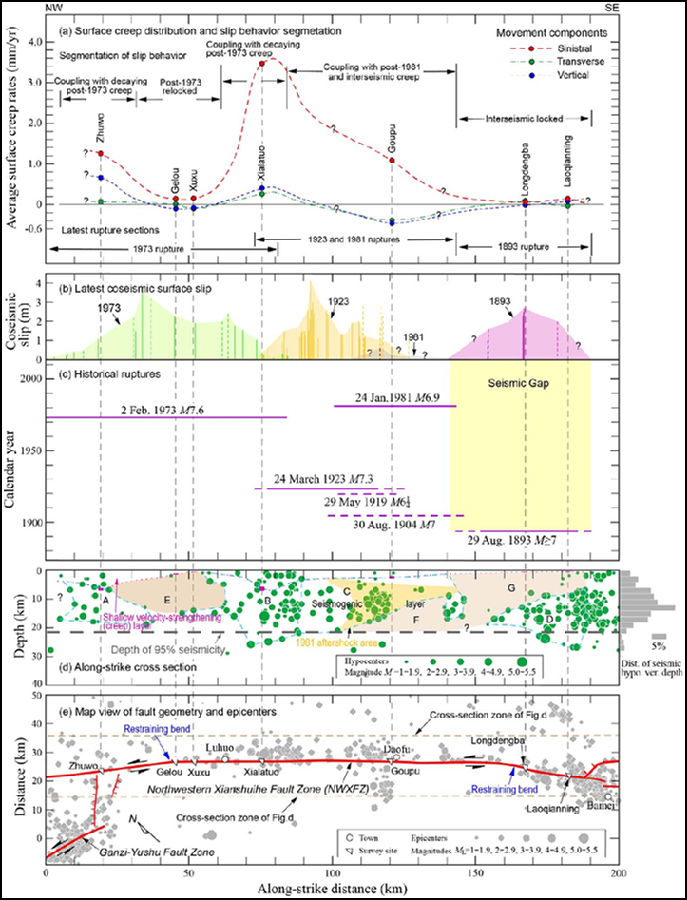
This study examines the ~200-km-long northwestern Xianshuihe fault zone (NWXFZ), southwestern China, using more than three decades of geodetic observations from fault-crossing short-baseline and short-leveling surveys at seven sites. These data enable estimates of creep rates and depths, and examination of the long-term slip behavior. The surface motion of the NWXFZ is dominated by sinistral creep, although sinistral, transverse, and vertical slip components show spatio-temporal variations. Combining these slip variations with data of earthquake rupture, coseismic slip, seismicity, fault geometry, and far-fault movement velocity, and using the velocity-and-state friction theory, our analysis indicates that the surface slip behavior of theNWXFZ is segmented along strike. The 1973 rupture section of this fault zone exhibits spatio-temporally variable slip behavior, showing time-decaying post-1973 afterslip on the northwestern and southeastern parts of the rupture at depths above 5.8-7.0 km with average sinistral-creep rates of 1.3 and 3.5 mm/yr, respectively, but being relocked in the central part of the rupture. The 1923/1981 rupture section is generally in locking state, with postseismic and interseismicsinistral-creep at 1.1 mm/yr on its central part at depths above 2.0–2.8 km. The 1893 rupture section has been tightly locked without creep since at least the early 1980s. The thickness of the shallow velocity-strengthening (or creep) layer and the restraining bendgeometry of the NWXFZ are the key factors that control spatio-temporal variations in surface creep rates. Two surface-observed locked fault portions are located within two different restraining bends in the NWXFZ, both of which act as compressive asperities and hence have enabled the long-term locking of these portions. Creep along the NWXFZ has also been affected to varying degrees by M6.5-Mw9.2 earthquakes at distances of 50-3800 km from the fault zone. Most of these effects have been removed from our estimates of the long-term average creep rates.

Fig. 1. Distributions of creep rate, slip behavior, co-seismic surface slip, historical ruptures, seismicity, and fault geometry along the NWXFZ. (a) Average creep rates of all three components (from Table 2); the sinistral-creep rate is shown with the estimates from the non-linear method. (b) The 1973 coseismic surface slips from Wen (1995; solid green lines) and from Papadimitriou et al. (2004) (and hence from field in-vestigations by R. Weldon and X. Wen in 1995 and 1996) (dashed green lines). The 1923 surface slips (solid and dashed orange lines) are from Li et al. (1998), with dashed orange lines indicating uncertain surface slips. The 1981 and 1893 rupture data are from Li et al. (1998; solid lines) and Papadimitriou et al. (2004; dashed lines). (c) Pattern of historical ruptures and seismic gaps (modified from Wen et al., 2008) where horizontal lines represent the extent of historical ruptures and dashed lines indicate inferred rupture extents. (d) Depths and uncertainties of shallow creep at all sites (shown as purple boxes) are derived from Fig. 8. A 95% cutoff depth in seismicity is used to infer the bottom boundary of the seismogenic layer (after Smith-Konter et al., 2011). The relocated seismic data are for the period between Jan. 1981 and Dec. 2012, and are from a final research report by Jiang et al. (2014). Relocations were performed by Fang Lihua using a simplex algorithm and an updated velocity model, and have the following uncertainties of hypocentral locations: < 1.5 km for 40% of the events and < 3.0 km for 70% of the events in the horizontal direction, < 2.0 km for 20% of the events and < 4.0 km for 40% of the events in the depth di-rection. Areas A–D are delineated with blue dashed curves and indicate fault patches with seismicity dis-tributions, whereas E–G indicate fault patches lacking seismicity. The 1981 aftershock area is shown after Yi et al. (2005) with aftershock hypocenters excluded. (e) Map view of the main fault trace and its geometry (Allen et al., 1991) with the relocated epicenters from Jiang et al. (2014). (For interpretation of the refer-ences to color in this figure legend, the reader is re-ferred to the web version of this article.)


